
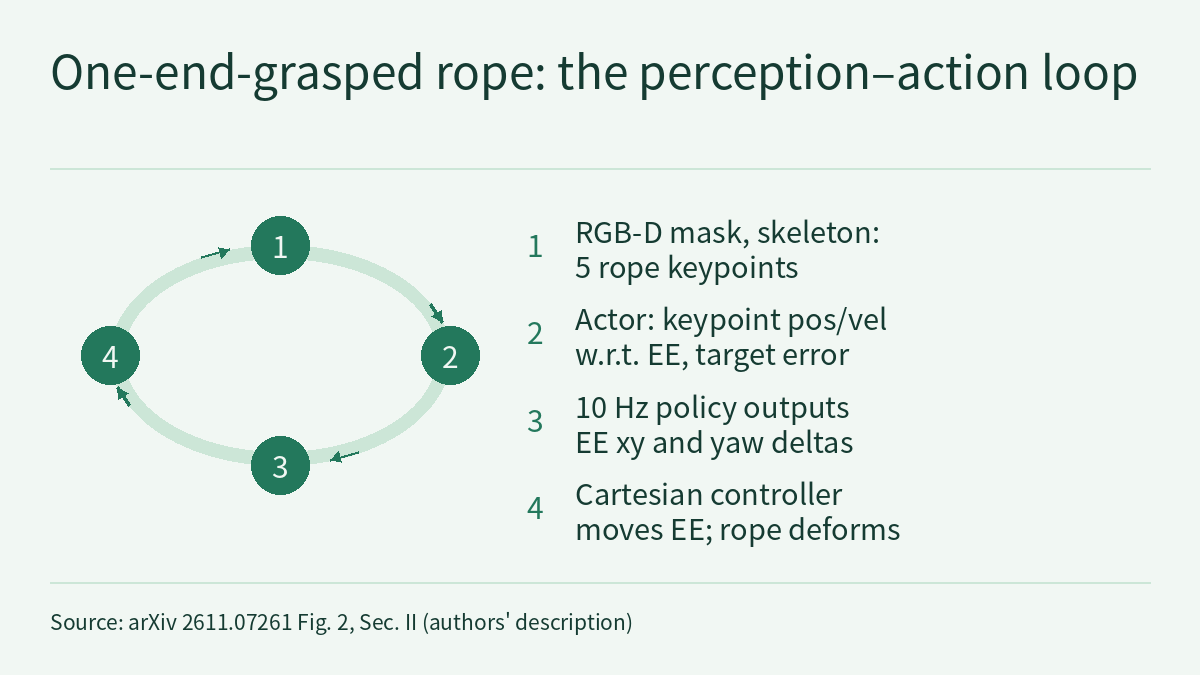
The preprint An Empirical Study of Reinforcement Learning for Keypoint Positioning of Deformable Linear Objects (arXiv 2611.07261, 2026-11-05, from the HRII Laboratory at the Istituto Italiano di Tecnologia, IIT) studies a narrow but common problem: a robot holds one end of a deformable linear object (DLO) such as a rope or hose and moves chosen points on it to targets on a table. The paper is an empirical study: it uses PPO to test the training stack, observation design, robustness training and transfer to a real robot one by one. The authors report that, without real-world fine-tuning and using markerless RGB-D keypoint estimation, the policies succeed in 9/10, 10/10 and 8/10 trials for single-point tracking, disturbance recovery and two-point tracking. All numbers below are author-reported [R]; this site has not reproduced them.
The task: one end grasped, planar, slow
One end of the rope is rigidly attached to the end effector (EE) of a Franka Emika Panda; the other end is free. The Cartesian controller only allows the EE to translate in the xy-plane and rotate about the z-axis. The paper restricts the task to slow planar motion and treats it as quasi-static at the control level, neglecting dynamic effects. At each step the policy outputs a normalized three-dimensional action, two translation increments and one yaw increment, which are multiplied by fixed scaling factors. The policy runs at 10 Hz, the simulation integrates at 1 kHz, and each training episode lasts at most 200 control steps (20 s).
There are two tasks. Single-point tracking moves the keypoint at the rope’s free tip to a target; two-point tracking also moves the keypoint attached to the EE to its own target. A keypoint counts as reached within ε = 0.03 m. The two-point reward is staged: the tip error is penalized throughout, while the error of the EE-attached keypoint is penalized only after the tip has entered its target region. If the tip leaves that region, the reward again prioritizes recovering the tip. This design connects directly to the failure types discussed below.
Training stacks: parallel simulation mattered more than a faster learner
The paper compares three complete PPO training stacks: PyTorch Stable-Baselines3 with CPU-based MuJoCo (SB3+mj, 4 parallel environments); the same simulation with only the learner replaced by the JAX-based Stable-Baselines Jax (SBX+mj); and MuJoCo Playground (MP), which runs JAX PPO together with the JAX-native MJX simulator on the GPU across 1024 environments. Each stack was tuned separately with Optuna (three tuning seeds per trial, on 8 CPU cores and one A100 80 GB), then trained from scratch on 5 held-out seeds; all later runs used 8 CPU cores and one V100 32 GB.
| Training stack | Final success rate | Area under the success-rate curve |
|---|---|---|
| SB3+mj | 0.860 ± 0.108 | 0.529 ± 0.048 |
| SBX+mj | 0.880 ± 0.110 | 0.532 ± 0.069 |
| MP | 0.950 ± 0.032 | 0.735 ± 0.077 |
Within a common wall-clock budget of about 240 minutes, the authors report that MP reaches a mean success rate of 0.95 while both CPU stacks reach only moderate success; over the same time MP collects about 13× more environment interactions. SBX+mj, which only swaps the learner, differs little from SB3+mj; the authors attribute this to the DLO physics simulation remaining the bottleneck. The environment count differs by 256× (1024 versus 4, this site’s arithmetic) while interactions differ by about 13×, so the number of environments should not be read as throughput. The authors also state that the three stacks differ at once in learning framework, simulation backend, parallelism and hardware, so this compares whole systems, not individual algorithms or simulators under control.
Observation design: relative keypoints and an asymmetric actor–critic
At deployment the policy only has vision-estimated keypoints, so the actor sees 5 keypoints, while during training the critic sees 12 keypoints plus privileged simulator information (the command-clipping magnitude and indicators for leaving the robot workspace and the work area). Keypoints are given as positions and velocities relative to the EE, together with the absolute position of the free tip in the robot-base frame. From the paper’s equations (1) and (3), the two-point actor observation has 37 dimensions and the critic observation 70 (this site’s arithmetic).
The ablation used the single-point task, with each of the four combinations trained for about 20 million steps on 2 seeds. The authors report that the EE-relative representation learns better than the robot-base-frame one, that the asymmetric actor–critic beats the symmetric one, and that “relative + asymmetric” performs best overall, so it is used for all later simulation and real-robot experiments. The text gives only learning curves for this ablation, not numerical values.
Robustness: paired comparisons and failure breakdowns say more than one success rate
Robust training (N+DR) adds zero-mean Gaussian noise at every step to the actor-observable positions, velocities, yaw and yaw rate, plus a random delay of at most one control step. Each episode randomizes the sliding-friction coefficient between rope and table, μ ∈ [0.5, 0.8], and scale factors for joint stiffness, actuator damping and passive damping (each between 0.95 and 1.05); disturbance-recovery training also applies an external force at a random time. Bending and torsional stiffness are not randomized, because the MP plugin used does not support changing them at runtime. Each condition is evaluated over 250 episodes (5 evaluation seeds × 50 episodes):
| Task | Condition | Successes / 250 | Success rate |
|---|---|---|---|
| Single-point | Basic | 249 | 99.6% |
| Single-point | N+DR | 241 | 96.4% |
| Single-point (disturbance recovery) | N+DR+D | 245 | 98.0% |
| Two-point | Basic | 231 | 92.4% |
| Two-point | N+DR | 222 | 88.8% |
The slightly higher rate with disturbances is not taken as evidence that disturbances help. Both conditions use the same targets and initial states, so episodes can be paired: 238 outcomes are unchanged, 8 change from failure to success and 4 from success to failure. The authors note that during training the force occasionally pushed the tip toward the target, which may partly explain the difference, and limit the conclusion to “robustness is retained”. The two-point task pairs the same way: 213 target pairs succeed under both conditions, 18 only under Basic, 9 only under N+DR and 10 under neither, so N+DR causes a modest net drop rather than a uniform loss of capability.
All 28 two-point failures under N+DR are timeouts. By type: the tip never reached its target (Type-1) in 19, or 67.9%; the tip reached it but the EE-attached keypoint did not (Type-2) in 2, or 7.1%; the tip reached its target and had left it by termination (Type-3) in 7, or 25.0%. Failures cluster at the edge of the workspace: “peripheral” pairs, where either target lies within 0.05 m of its admissible boundary, make up 44.4% of the 250 episodes but 78.6% of failures, and the failure rate is 19.8% at the periphery against 4.3% in the interior. Wider target separations are harder: success is 92.7%, 90.9% and 83.1% for separations below 0.10 m, 0.10–0.20 m and at least 0.20 m, which the authors call a descriptive association.
A separate single-point policy trained jointly on rope lengths of 0.300, 0.375 and 0.450 m reaches 84.4%, 86.0% and 86.4% at those lengths. All three lengths were in training, so this measures in-distribution robustness, not extrapolation to an unseen length. The text does not state the evaluation condition for this policy, so this site does not compare it directly with the fixed-length 96.4%.
Real robot: 30 trials with no fine-tuning
An Intel RealSense D435i mounted above the workspace supplies images at 30 Hz; the camera is registered to the robot-base frame with ArUco-based extrinsic calibration, and the perception and control pipeline is integrated through ROS. A fine-tuned YOLO26-seg model segments the rope, the mask is skeletonized, and 5 approximately equally spaced keypoints are taken along the centerline and projected onto the table. The authors report a mask precision of 98.81%, recall of 99.13%, F1 of 98.97%, mAP@0.5 of 99.48% and mAP@0.5:0.95 of 79.30%, with inference at 29.8 FPS. The policies run with no change to the network and no real-world fine-tuning, still at 10 Hz.
The primary evaluation uses a silicone catheter 0.004 m in diameter, with 10 trials per task, and all trials are included:
| Task | Success | Median completion time of successful trials [IQR] | Failure type |
|---|---|---|---|
| Single-point tracking | 9/10 | 9.30 s [6.70, 14.40] | Type-1 |
| Disturbance recovery | 10/10 | 6.55 s [4.85, 8.32] | — |
| Two-point tracking | 8/10 | tip reached 8.55 s [7.19, 12.30]; task completed 9.05 s [7.80, 12.47] | Type-3 |
In the two-point task, completing the whole objective after the tip arrived took a median of only 0.56 s more [IQR 0.17–2.02 s]. Both failures were cases where the tip reached its target and then left it, the same mechanism as Type-3 in simulation. The authors group the real-world failures into three causes. The robot itself sometimes occluded the rope: after short occlusions the policy could recover once valid observations returned near the goal, but longer ones led to incorrect actions. The catheter is very compliant and sometimes bent sharply and released stored elastic energy, causing sudden deflections in compact two-point configurations. Perception delay sometimes made the policy overshoot the target; the authors say training with noise and delay reduced this and allowed recovery in several trials.
How this relates to the course on this site
Physical AI Lab 0.4 and 1.4 covered speed-up figures for GPU-parallel simulation and why every multiple needs its baseline. This paper adds a deformable-object case: accelerating only the learner barely helped, and the gap opened once simulation was parallelized as well. What it reports is success rate and interaction count under one wall-clock budget, not a single speed-up factor.
Physical AI Lab 2.5 argued that domain randomization should state which model quantity it changes and over what range. This paper states its friction range, stiffness and damping scales, and observation noise and delay, and also says that bending and torsional stiffness could not be randomized. The real-world failures where the catheter bent sharply and sprang back can be read alongside that gap; this is this site’s reading, and the paper does not attribute those failures to the unrandomized stiffness. A delay of at most one control step at 10 Hz corresponds to 0.1 s (this site’s conversion); the link between latency and control rate is covered in 2.6.
Physical AI Lab 1.8 practised splitting a “net gain” into a paired table. The 8-versus-4 and 18-versus-9 counts in this paper are that reading in practice: when overall success rates differ by a few points, first check how many episodes actually changed and in which direction. For how a staged reward shapes behaviour, compare 1.7.
Limitations
- This is an arXiv preprint; all numbers are author-reported [R] and this site has not reproduced them. The text this site read contains no code or dataset link.
- Each real-world task has only 10 trials with a single silicone catheter; the paper gives no confidence intervals for the real-world results, and the text this site read does not state the catheter’s length. The default simulated rope length is 0.30 m.
- The task is limited to planar, slow, one-end-grasped manipulation treated as quasi-static. The authors list shape control, three-dimensional manipulation and generalization to unseen DLOs, environments and task configurations as future work.
- The stack comparison changes the learning framework, simulation backend, parallelism and hardware at once, and the authors state explicitly that it is not a controlled comparison of single components. The observation ablation uses only 2 seeds, and the text gives curves but no numbers.
- The policies are task-specific: the observation size depends on the number of tracked points M, so a separate policy is instantiated for each M. The variable-length experiment covers only the three lengths seen in training.
- The text this site read does not state the size or split of the test set behind the segmentation metrics.
- The real-robot trials validate task success, not safety; simulated success rates do not replace real-world testing.
Links
- An Empirical Study of Reinforcement Learning for Keypoint Positioning of Deformable Linear Objects (arXiv 2611.07261)
- Full paper in HTML
- Physical AI Lab 0.4: Ten Thousand Tries in a Virtual World — Putting the Conditions Back on Three Simulation Numbers
- Physical AI Lab 1.4: A Map of Simulators — Counting the Cost of the Timestep, Finding Where Contact Splits Two Runs, and Pinning Three Speed-ups to Their Baselines
- Physical AI Lab 1.7: Reinforcement Learning — Working Out One Episode’s Return to See How a Reward Gets Gamed, Then Reading the Paper’s Terrain Curriculum and Time-out Resets
- Physical AI Lab 1.8: Evaluation — Splitting a “Net Gain of 2” into a Paired Table, Then Checking the Failure Labels and Random Seeds
- Physical AI Lab 2.5: Sim2real with Domain Randomization and System Identification — Putting Two Papers’ Numbers Back in Their Setups, Then Working Out Friction by Hand from One Push of a Cup
- Physical AI Lab 2.6: To the Edge — Working Out the Control-Rate Ceiling from a Latency Log, Telling Whether Quantization Saves Size or Time, Then Sizing an Action Chunk
- Physical AI Lab: a physical AI course where every number can be checked (course outline)