
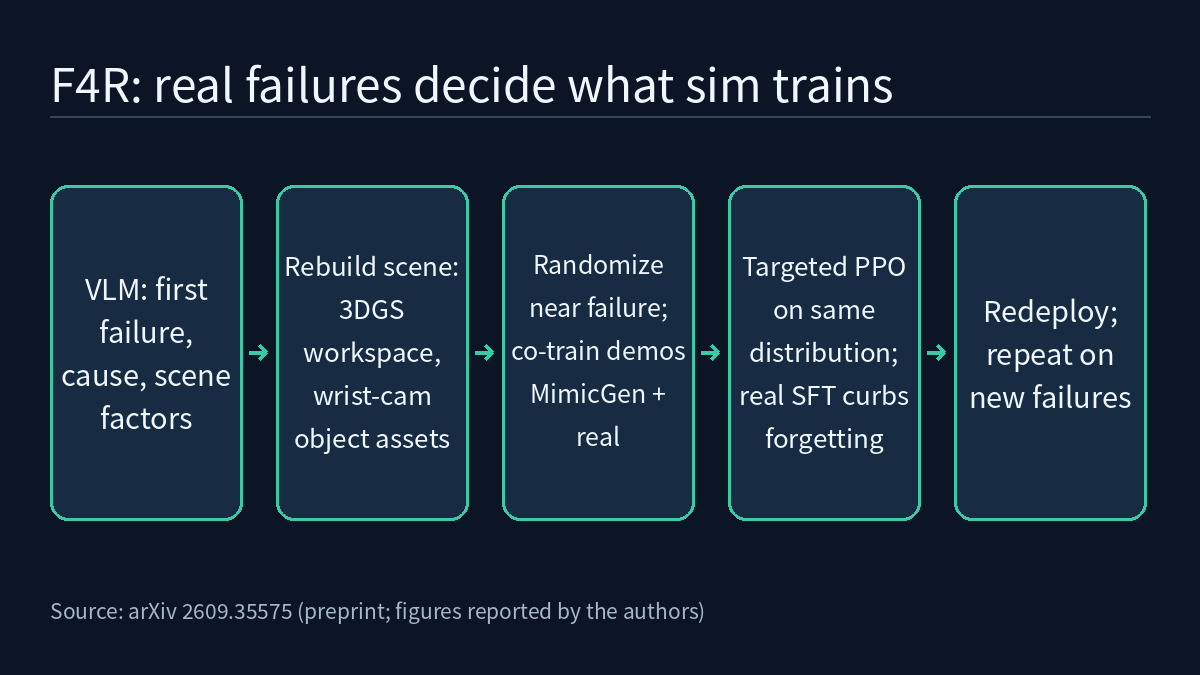
A VLA policy deployed on a real robot fails under conditions its demonstrations did not cover, and the usual fix is to collect another batch of real corrective demonstrations for those failures. F4R (Failure for Rising, arXiv 2609.35575, 2026-09-28, evidence level [R]), from authors at Nanyang Technological University, Xi’an Jiaotong University and Dexmal, takes a different route: a VLM agent finds the earliest point of failure and the scene factors behind it in the failure video, the failure is rebuilt as an interactive simulation scene, randomization and training are concentrated around that failure, and the new policy is redeployed so that fresh failures feed the next round. What makes the paper worth reading is that it matches both baselines to one hour of data-preparation time and separately measures the effect of where the randomization is placed.
The four steps of the loop
- Recognition and diagnosis: a task-specific binary success checker first separates out the failed rollouts. On the two video streams, from the wrist camera and a fixed external camera, F4R proposes a few candidate time windows based on visual change and lays them out as chronologically ordered “evidence boards” for a VLM diagnostic agent. The agent outputs a structured failure record: the earliest failure time, the relevant objects, the failed subtask and failure type, failure-relevant scene factors (such as pose, friction, lighting, background, viewpoint and clutter), frame-grounded evidence, and a confidence value. This record decides what gets reconstructed and which variables get randomized.
- Reconstruction: the workspace is captured once as a short RGB video on a smartphone, reconstructed with 3D Gaussian Splatting and registered into Isaac Sim. This one-time step is, according to the authors, the only human-assisted stage of the whole pipeline. For each relevant object, the robot itself captures multi-view RGB-D with its wrist camera; TSDF fusion, geometry completion with ShapeR and PBR materials from Hunyuan3D yield an asset that supports both physical simulation and photorealistic rendering. For articulated objects, a VLM together with P3-SAM recovers the part-level kinematic structure.
- Two-stage refinement: the reconstructed scene is first expanded by “failure-aware” domain randomization, in which failure-relevant variables are sampled around the recovered configuration and the others stay fixed. In Stage I, successful historical real-world trajectories serve as seeds for MimicGen, which generates corrective demonstrations in these randomized scenes; they are co-trained with the original real data. In Stage II, PPO runs on the same distribution with the original task reward only, without failure-specific reward shaping, while an SFT loss on the real data is kept to prevent forgetting.
- Redeployment: the new policy is retested on the earlier failures and on new configurations, and failures that persist or newly appear enter the next round.
A budget-matched comparison
The platform is a UR5 with a Robotiq 2F-85 gripper and two RealSense D435i cameras; the policy is initialized from π0.5 and fine-tuned through LoRA adapters. The authors define ID as configurations covered by the original data-collection distribution, and OOD as failure conditions that appeared during deployment but are absent from that distribution; each real-world setting is run for 20 trials. All three methods get one hour: Targeted BC spends it collecting corrective demonstrations on the real failure distribution, while RLinf-Co and F4R spend 50 minutes on reconstruction and 10 minutes collecting simulated experience in 256 parallel environments. The authors state that scene reconstruction actually takes 25–30 minutes and object preparation 5–10 minutes, and that the scene only needs rebuilding when the physical workspace changes. RLinf-Co and F4R share the architecture, training settings and rollout budget; the only difference is that RLinf-Co uses broad domain randomization, while F4R concentrates randomization around the diagnosed failures.
| Method (average of four tasks, real robot) | ID | OOD |
|---|---|---|
| Base | 62.5% | 26.25% |
| Targeted BC | 91.25% | 71.25% |
| RLinf-Co | 87.5% | 77.5% |
| F4R | 93.75% | 90.0% |
According to the paper, F4R beats Targeted BC by 18.75 percentage points and RLinf-Co by 12.5 points under OOD conditions. The gap is largest on the multi-stage Place Block in Drawer task: when the drawer’s orientation differs from the original demonstrations, the base policy fails every closing attempt (0% OOD), Targeted BC reaches 60%, and RLinf-Co and F4R reach 80% and 85%. The authors take this to mean that the supervised fine-tuned VLA learned orientation-specific action patterns rather than transferable drawer kinematics, and that simulated interaction helps most with such contact-sensitive behavior. They also note that RLinf-Co’s training loss converges, so they do not put the remaining gap down to insufficient optimization; instead they suggest that broad randomization may enlarge the sim-to-real gap and dilute training around the relevant failures. That is the authors’ conjecture, not a separately verified finding.
Which part contributes most
| Variant (average of four tasks, real robot) | ID | OOD |
|---|---|---|
| Without failure diagnosis (broad randomization instead) | 87.5% | 77.5% |
| Without real-data supervision | 85% | 86.25% |
| Without Stage I co-training (RL with real-data SFT only) | 76.25% | 32.5% |
| Without Stage II RL (co-training only) | 90% | 83.75% |
| Full F4R | 93.75% | 90% |
Three readings. First, skipping Stage I and using only sparse-reward RL (with the real-data SFT term kept) lifts OOD only from 26.25% to 32.5%; the authors argue that the base policy rarely stumbles onto success in severe failure regions through exploration, so most of the gain comes from Stage I’s corrective demonstrations, with RL adding a further 3.75 (ID) and 6.25 (OOD) points. Second, removing real-data supervision costs 8.75 points ID but only 3.75 points OOD, which the authors read as simulation data fixing weaknesses and real data mainly preventing forgetting. Third, the “without failure diagnosis” row has the same numbers as RLinf-Co in the table above, 87.5% / 77.5%. Each differs from the full F4R only in where randomization is placed (broad rather than concentrated around the diagnosed failures), and each trails the full F4R by 6.25 points ID and 12.5 points OOD. The main text reviewed here does not say whether the two rows come from the same run.
How reliable are the diagnosis and the simulation?
Two parts of F4R’s loop run without a human, and the authors check each:
- Automatic diagnosis: ten trajectories from each of eight tasks, 80 in total, were manually annotated with failure stage and cause, and GPT-5.5 equipped with the authors’ robot-video-failure-analyzer skill predicted both; a diagnosis counts as correct only if both match. It was right on 69 on the first attempt (86.25%) and on 74 within two attempts (92.5%); of the remaining six, four involve subtle camera-viewpoint shifts and two involve illumination changes. On the public ViFailback dataset, the best-performing GPT model reaches nearly 70% accuracy without task-specific adaptation.
- Sim–real consistency: policies were trained with 10, 30 and 50 real demonstrations for each of eight tasks, giving 24 checkpoints evaluated under matched configurations in simulation and on the real robot. The paper reports a Pearson correlation of r = 0.7625 (p = 1.49×10⁻⁵) between the two success rates. The authors also state that deviations from the diagonal reflect residual gaps in appearance, contact dynamics and execution sensitivity, so simulated success is not an exact estimate of real-world success; it serves as a behavioral proxy in the sense of ranking.
For the multi-round loop, the authors ran three consecutive cycles on two tasks: Stack Bowls rose from 30% to 80%, 90% and 95%; Pick Fruits went from 40% to 100% in the first cycle and stayed there for the next two.
How this relates to earlier articles on this site
Frontier Radar deep dive | Simulation and evaluation includes evaluating whether a policy can recover when something goes wrong mid-task; F4R asks how a failure, once it has happened, can be turned into the next round of training data. Frontier Radar deep dive | Training and self-improvement lists learning from deployment as the third stage of VLA post-training, and F4R is one concrete implementation of that stage, in which deployment failures decide both what simulation generates and where RL explores. Compared with Frontier Radar | VLaRL, both use RL in simulation for VLA policies, but VLaRL freezes the VLA and learns only a residual, whereas F4R updates π0.5’s LoRA adapters directly. For the planned L2 episode on domain randomization in sim2real in the course overview, the “without failure diagnosis” ablation is a concrete example: the randomization range is itself a variable that has to be designed and tested.
Limitations
- This is an arXiv preprint and every number is reported by the authors; the material this article is based on contains no independent reproduction.
- OOD here means failure conditions that were observed during deployment and then used by F4R for reconstruction and training. They are out of distribution relative to the original demonstrations, not unseen by F4R itself; Targeted BC also collects data on this failure distribution.
- Each real-world setting has 20 trials, and the main text gives no confidence intervals or significance tests; on a single task, a 5-point gap corresponds to just one success.
- “No additional real-world corrective demonstrations” does not mean no real data: Stage I uses successful historical real trajectories as MimicGen seeds (supplemented with AnyGrasp grasp proposals when there are too few), a real-data SFT term is kept throughout training, the workspace reconstruction needs one manual smartphone capture, and failure detection relies on a success checker written for each task.
- The diagnosis evaluation uses a closed model, GPT-5.5; the authors acknowledge that the remaining errors cluster around subtle visual changes that require comparing across frames.
- The experiments are limited to single-arm tabletop manipulation; the policy experiments cover only four tasks, and the multi-round loop was run for three cycles on only two tasks.