The Genie Sim Benchmark technical report (arXiv 2611.15020, a preprint) uses 22 real–simulation task pairs to test one question: does a policy fine-tuned on real-robot data score about the same in simulation as on the real robot? The authors report a Pearson correlation of 0.9686 between the two sides’ Scores, with per-pair differences from −0.110 to +0.080. The report also presents system-identification evidence at the robot and object levels, but the authors state that these physical-level results do not show a reduction in task-score discrepancy. This article reads the three evidence layers separately and sets out what the 0.9686 can support. All numbers below are reported by the authors; this site has not reproduced them.
Three evidence layers and the pairing protocol
The report divides its evidence into three layers, each with its own metrics and experimental units: robot execution (dual-arm identification of G2 crsB, closed-loop position and torque), object interaction (five representative objects, three execution stacks) and task outcomes (22 real/simulation Score pairs). The authors note that the arrows in their figure organize the process and do not denote a single end-to-end experiment.
The task layer covers four configurations: G1 Omnipicker with 8 pairs, G2 Swiftpicker with 6, G2 Wuji with 1 and Arx X5 with 7, for 22 pairs over 16 task names in five task families: selection and reasoning, placement and sorting, bimanual handover, stacking, and textile manipulation. The newly added experiments start from a π0.5 baseline with supervised fine-tuning (SFT) on real-robot data collected for each task; the resulting task-specific models then run inference on the real robot and in simulation. The 8 G1 pairs are taken from the earlier Genie Sim 3.0 report, and this study did not perform system identification specifically for G1.
Each simulation layout corresponds instance by instance to a real-robot test layout, and the evaluation criteria, scenes and test settings are aligned between the two. On the real robot, test personnel take part throughout, assign scores by hand and adjudicate failures and timeouts; in simulation, scores are assigned automatically under the same criteria. Both sides use the same number of trials: 30, 50 or 100 per environment. Score is averaged over scored stages, and the paper states that it differs from the separate end-to-end (E2E) field and from binary task success.
The platform description says Genie Sim Benchmark has 78 simulation tasks across four capability dimensions (instruction following, spatial reasoning, robustness, general manipulation). That description cites unpublished project documentation; the real-robot pairing in this report covers the 16 task names above.
The 22 Score pairs: what 0.9686 can tell you
With all 22 pairs weighted equally, the MAE is 0.0405, the RMSE is 0.0520 and the mean signed gap (Sim − Real) is −0.0068. The authors note that these are differences in task Score, not success-rate differences, and not uncertainty intervals. The four pairs with the largest gaps are below (Table B1 displays two decimals; calculations use full precision):
| Configuration | Task | Real | Sim | Δ | Trials per side |
|---|---|---|---|---|---|
| Arx X5 | Recognize Size | 0.77 | 0.66 | −0.11 | 50 |
| G1 Omnipicker | Sort Fruit | 1.00 | 0.90 | −0.10 | 50 |
| G2 Swiftpicker | Select by Color | 0.86 | 0.76 | −0.10 | 100 |
| Arx X5 | Folding Clothes | 0.72 | 0.80 | +0.08 | 50 |
What follows is this site’s reading and is an inference. Across the 22 pairs, real Scores run from 0.24 (Arx X5 Stack Blocks) to 1.00 (G1 Sort Fruit). Task difficulty varies widely, and when simulation reproduces that spread across tasks, the correlation will be high. To use simulation to compare two policies on the same task, what matters is whether the per-pair gap is smaller than the difference between the policies. The report evaluates one task-specific model per robot–task pair, so it does not test whether simulation preserves the ranking of different policies on the same task. A gap of 0.10 also appears in evaluations with 50 or 100 trials per side, and the report gives no intervals, so a reader cannot tell which gaps exceed the variation expected from the trial count. For why an interval is needed and how many trials to run, see Physical AI Lab 2.8: Reproducible Evaluation.
The 14 pairs before and after system identification
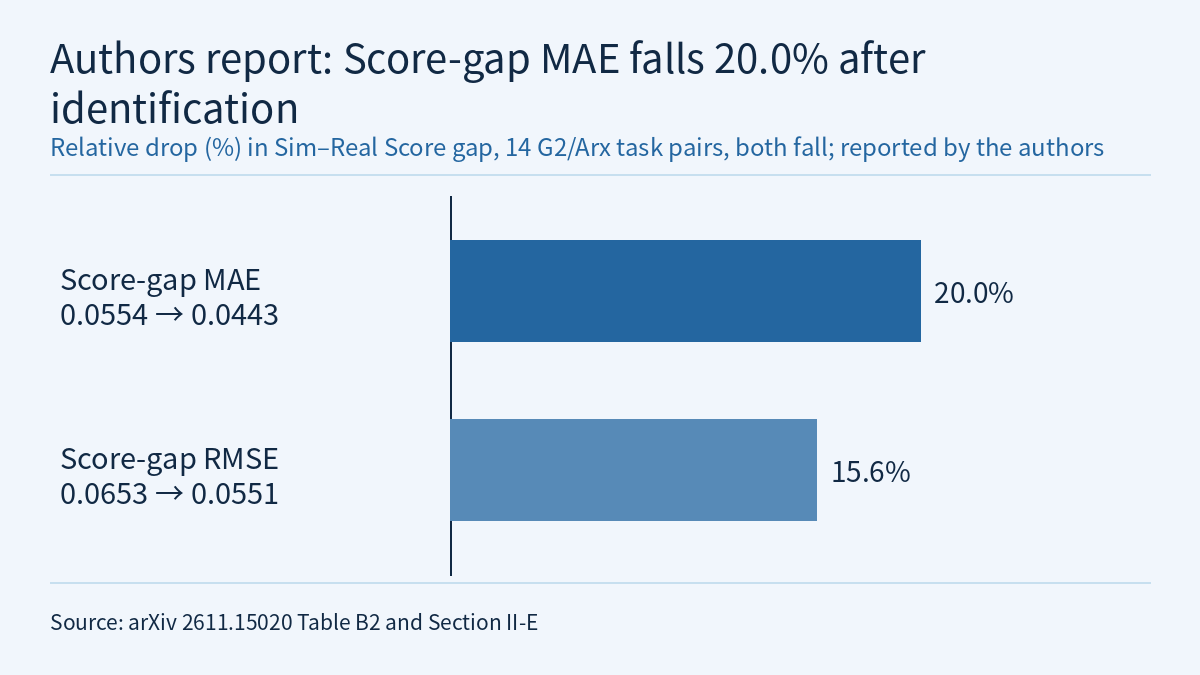
G2 Swiftpicker, G2 Wuji and Arx X5 have simulation Scores from before and after system identification, 14 pairs in total. The paper states that these are repeated conditions of existing robot–task pairs, not additional task coverage, and the real reference stays the same. After identification, the MAE falls from 0.0554 to 0.0443 (down 20.0%), the RMSE falls from 0.0653 to 0.0551 (down 15.6%) and Pearson r rises from 0.9518 to 0.9669; the mean signed gap moves from −0.0004 to −0.0086.
Pair by pair, 8 have a smaller absolute gap, 1 has a larger gap and 5 are unchanged. G2 Swiftpicker has 4 improvements and 2 unchanged pairs, the single G2 Wuji pair improves, and Arx X5 has 3 improvements, 1 deterioration and 3 unchanged pairs. The one that worsens is Arx X5 Recognize Size, whose gap goes from −0.08 to −0.11. The largest improvement is G2 Swiftpicker Fold Cloth, from +0.10 to +0.03. The Arx X5 MAE only falls from 0.0500 to 0.0479, and its RMSE stays at about 0.0601; the authors note that X5 lacks force control, so its parameter identification uses a simplified model.
In the two-decimal Table B2, most pairs change their absolute gap by 0.00 to 0.03. The report gives no intervals, so the paper alone does not show whether these small changes exceed the variation expected from the trial count (this site’s inference).
The robot and object layers: one recording and five objects
Robot layer. Each G2 crsB arm has 7 joints, and the model has 98 unknowns per arm: 70 link inertial parameters, 7 armature values, 14 friction coefficients and 7 biases. The authors point out that not all of these are independently observable from joint torque, so they estimate them in three stages: constant-speed sweeps for friction, sine excitation for armature, then a synchronous seven-joint Fourier trajectory for the inertial parameters, with 18 recordings per arm. A separate 32.6503 s teleoperation recording was excluded from both mechanical identification and servo-gain search. External position targets pass through simulated motion-controller command shaping, and a calibrated position servo then drives the MuJoCo model. Using 3,165 samples after a 1 s warmup, per-joint position RMSE across both arms spans 0.00614–0.03522 rad, and torque RMSE against current-derived torque spans 0.73545–4.00099 N·m. The authors state that this single recording tests the combined execution chain; it does not isolate the contribution of mechanical identification and does not establish task-level gains. This replay also uses MuJoCo’s native Coulomb friction, not the fitted smooth friction function.
Object layer. The five objects are a kettle, a gum box, a sponge, a shuttlecock and a pen, each with a single recorded real interaction. The original study fits parameters in MuJoCo 3.10.0, freezes them, and transfers them to MJWarp (MuJoCo-Warp 3.10.0, loaded through Newton 1.4.0) and PhysX (Isaac Sim 6.0.0 RC). Results depend on the object and the engine:
- Kettle lid-centre RMSE falls in all three stacks: MuJoCo 39.56 → 25.24 mm, MJWarp 40.98 → 25.12 mm, PhysX 38.66 → 26.23 mm.
- The gum box improves slightly in MuJoCo (12.78 → 12.23 mm) and worsens in MJWarp (13.37 → 13.58 mm) and PhysX (10.99 → 11.46 mm).
- Transferred unchanged to PhysX, the sponge’s error rises from 25.50 mm to 524.61 mm and the object is not lifted; the shuttlecock and pen roll away in PhysX before the gripper closes.
- With native PhysX contact and damping settings (for example, 800 N/m finger-contact stiffness and 5 N·s/m damping for the sponge), both the baseline and the fitted parameters complete the recorded tasks. Under these matched settings, sponge centre RMSE goes from 41.54 to 26.73 mm, but its vertical error grows from 13.40 to 19.38 mm; shuttlecock RGB error worsens from 20.47 to 21.05 px, and the authors still recommend its baseline; the pen goes from 9.72 to 9.31 px, a change smaller than the roughly 3 px annotation uncertainty.
From this the authors separate two outcomes: completing a task does not mean identification helped, and a lower aggregate error does not mean every coordinate improved. They also state that these results do not establish a causal reduction in benchmark task-score discrepancy. Physical AI Lab 2.5 works out friction by hand from one push of a cup; this report applies the same idea to real robots and objects and also shows where it stops: the sponge parameters fitted in MuJoCo, moved unchanged to PhysX, failed to lift the object.
Limitations
- This is an arXiv preprint. All numbers are reported by the authors, and this site has not reproduced them. Real-robot Scores are assigned by hand by test personnel.
- None of the task, robot or object results come with confidence intervals or repeated real trials; time samples are correlated, not independent trials. The “held-out” time windows in the object study are later segments of the same recording, and the authors state that they are not blind tests.
- The 8 G1 pairs among the 22 reuse Genie Sim 3.0 data and did not go through this study’s system identification.
- The authors list implementation details of the teleoperation replay that are still pending, including limiter thresholds, coupling rules, filter initial states and actuator-limit settings.
- The VLM priors and agent-selected interactions mentioned in the report are, by the authors’ account, not yet executed or validated.