Most robot manipulation benchmarks in simulation grow sideways: they move fairly simple skills such as pick-and-place, pushing and door opening into more scenes and onto more objects. In the preprint ManiLadder (arXiv 2611.16374, 2026-11-12), Chongkai Gao and colleagues at the National University of Singapore and other institutions ask a different question: which level of manipulation difficulty can a policy reliably solve? They grade 112 simulated tasks into 4 levels by the success rate of one fixed reference policy under a shared protocol, and revise each task until it falls into its target range. To read the levels, first check which policy they are anchored to and how much agreement remains when the policy changes. All numbers below are reported by the authors [R]; this site did not run the authors’ code.
How the tasks are organized
The 112 tasks form 32 suites of 3 to 4 tasks each. Tasks in a suite share difficulty level, object class and embodiment, and differ in skill or object. All four levels follow the same three axes. Objects are rigid (including articulated objects such as doors and drawers) or deformable. Embodiments are single-arm gripper, single-arm dexterous hand, dual-arm gripper and dual-arm dexterous hand; the arm is a Franka Panda, the hand a LeapHand, and the few tasks that need base motion use TidyBot++. Skills are grouped from the literature into 9 families, among them tool use, contact-rich assembly and dynamic manipulation. Deformables are split by dimension: ropes are articulated chains of capsule-shaped rigid bodies, cloth uses a PBD solver, clay-like material MPM and liquids SPH. The authors say ManiLadder is the first simulation benchmark with more than 40 deformable-object tasks in a well-organized structure. The simulator is Genesis, with a Gym-style interface.
The standard training set has 20 scripted demonstrations per task, 2,240 trajectories in total, at 20 Hz; single-arm tasks have 4 views and dual-arm tasks 5, with images at 640 × 480. The standard observation is RGB images plus one task instruction, with no proprioception and no privileged simulator state. External pretraining is allowed if the checkpoint and available training-data information are disclosed. Each task is evaluated on a fixed set of 50 test initialization seeds, kept separate from the demonstration seeds and shared by all methods.
How difficulty is calibrated
The reference policy is a small flow-matching imitation policy with 50M learnable parameters: a frozen RADIO visual encoder reads multi-view RGB, and a Transformer encoder–decoder denoises action chunks by flow matching. Each task gets 20 demonstrations and 40k training steps at batch size 256, with a 50-episode evaluation every 5k steps. The best success rate during training, s(T), sets the level:
| Level | Reference-policy success s(T) | Successes out of 50 episodes (calculated by this site) |
|---|---|---|
| Level 1 | 60%–100% | 30–50 |
| Level 2 | 24%–58% | 12–29 |
| Level 3 | 6%–22% | 3–11 |
| Level 4 | 0%–4% | 0–2 |
With 50 episodes a success rate moves in steps of 2 percentage points, so 58% and 60%, 22% and 24%, and 4% and 6% are adjacent steps and the ranges leave no gaps. When a task misses its target range, the authors change its design (initialization range, spatial tolerance, object complexity, temporal coordination and so on), recollect demonstrations, retrain and re-evaluate. They report about four such rounds per task on average, and read this as a large gap between human intuition about difficulty and the empirical signal under a standard protocol. They also state that ManiLadder does not try to define an absolute, policy-independent difficulty: the reference policy is used as a measuring instrument.
How much of the grading survives new seeds and new policies
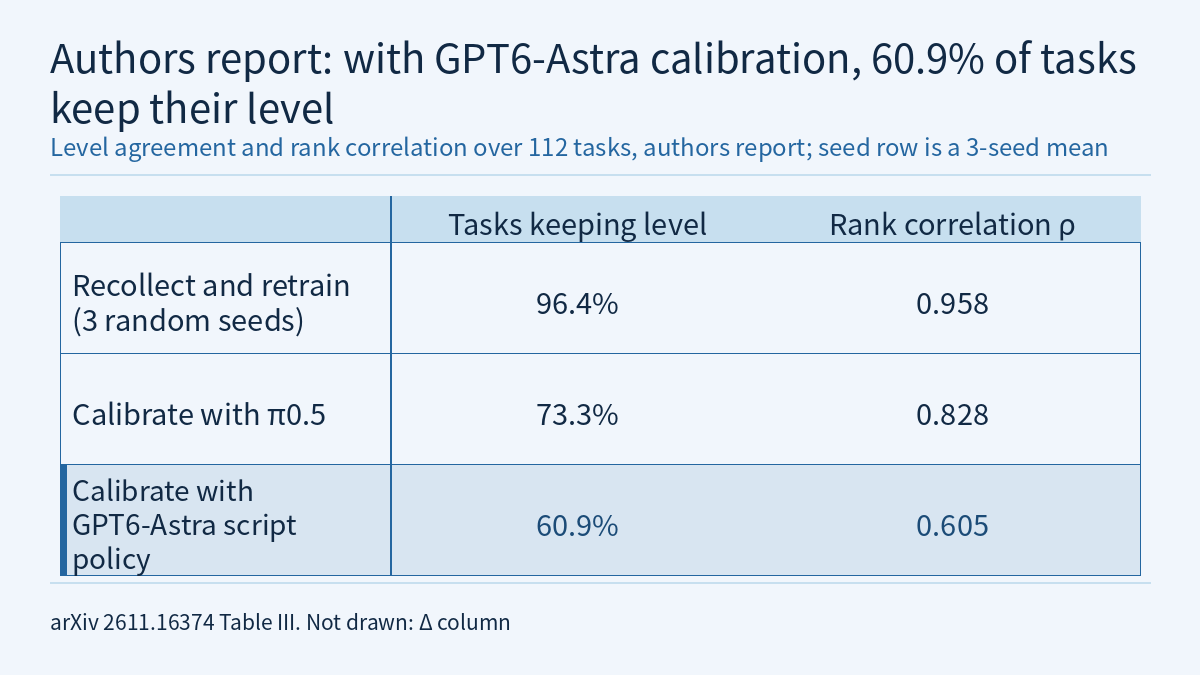
To check the instrument, the authors ran two sets of checks, each metric computed over all 112 tasks. The first recollected 20 demonstrations under 3 random seeds, then retrained and re-evaluated. The second left the tasks unchanged and redid the calibration with two other policies: π0.5, a large pretrained flow-matching VLA, and the GPT6-Astra script policy, in which GPT-6 Astra Medium acts as a coding agent that synthesizes executable Python policies from 20 demonstrations and up to 20 environment interaction episodes. ρ is the correlation of task ranks with the original calibration, Δ the mean absolute change in success rate, and A the share of tasks that keep their original level (Table III of the paper):
| Setting | ρ | Δ (percentage points) | A (%) |
|---|---|---|---|
| 3 random seeds | 0.958 ± 0.006 | 5.67 ± 0.361 | 96.4 ± 3.100 |
| π0.5 | 0.828 | 12.95 | 73.3 |
| GPT6-Astra | 0.605 | 18.26 | 60.9 |
From A, about 26.7% of tasks change level when π0.5 does the calibration, and about 39.1% with GPT6-Astra (calculated by this site). The authors stress the other side: the average success rate of all three methods falls monotonically from Level 1 to Level 4, so the level-wise trend carries beyond the reference policy. Individual tasks differ a lot. GPT6-Astra reaches 100% on Stack6Blocks-v1 and 84% on DualArmRubikCube-v1, where both imitation policies reach at most 8%, yet it does poorly on the lower-level PushSoccer-v1 and ShapeTToI-v1.
The authors annotated four properties per task: temporal score, object complexity, manipulation complexity and perception difficulty. Figure 6 of the paper shows the temporal score correlating negatively with success, and tasks with higher manipulation complexity or perception difficulty also tend to have lower success. From this the authors conclude that difficulty comes from several factors rather than any single property.
Attained Level: how far up the ladder a method gets
The benchmark’s summary metric is the Attained Level (AL). A method attains a level when, in that level and in every level below it, at least a fraction ρ of the tasks reach success threshold τ. The paper fixes ρ = 0.8 and reports AL@50 (τ = 0.5) as the primary metric and AL@80 (τ = 0.8) as the strict one; with 50 episodes these mean at least 25 and at least 40 successes. AL = 0 means the Level 1 criterion is not met. Results under single-task training (ST):
- Small flow-matching policy: AL@50 = 1, AL@80 = 0.
- π0.5: AL@50 = 1, AL@80 = 0.
- GPT6-Astra: AL@50 = 0, AL@80 = 0.
GPT6-Astra has a higher average success rate than both imitation policies on Levels 2–4, yet its AL is 0. The definition explains it: a level requires the coverage criterion in every lower level too, and GPT6-Astra misses it at Level 1. AL and average success answer different questions, so a report should give both. Agentic methods use the D20-E20 setting: the same 20 demonstrations plus a budget of 20 exploration episodes. During development they may read online RGB and proprioception; task-specific expert code, hidden simulator state and evaluation outcomes are prohibited, and the controller is frozen afterwards. The authors note that GPT6-Astra gets extra exploration episodes and proprioceptive observations, so its gains cannot be attributed solely to model capacity.
Findings from the experiments
- No method leads everywhere. Against the small flow-matching policy, π0.5 is 27.5 percentage points higher on Level 1 rigid single-arm dexterous tasks, 36.0 higher on Level 2 deformable single-arm dexterous tasks and 34.0 higher on Level 3 deformable single-arm gripper tasks; it is 23.5 lower on Level 1 rigid single-arm gripper tasks and 27.5 lower on Level 2 rigid dual-arm dexterous tasks. Against π0.5, GPT6-Astra is higher on all four Level 3 rigid suites (by 7.0 to 31.3 points), 63.3 higher on Level 2 deformable dual-arm gripper tasks and 37.5 higher on Level 4 rigid dual-arm gripper tasks, but scores 0 on Level 3 deformable dual-arm dexterous tasks.
- Transfer across levels helps little; transfer between suites within a level mostly helps. With π0.5 trained on a source set and then fine-tuned on a target set, only L2 → L1 improves (+4.1 percentage points); L1 → L2 and L3 → L2 give −2.3 and −4.4, and Level 2 pretraining leaves Level 3 essentially unsolved. Five of the six cross-suite settings within Level 2 are positive, the largest being rigid → deformable (+9.2) and between the two end-effector types (+6.1, +7.0).
- One policy trained on all 112 tasks does much worse. MT-A, a single π0.5 policy trained jointly on all tasks, is below single-task training on all 32 suites: Level 1 falls from 75.4% to 25.9%, Level 2 from 40.7% to 8.2%, Levels 3 and 4 are at 0.1% each, and overall it is 8.6% against 33.5%. As the paper words it, MT-A’s total training steps are 112 times the single-task budget.
- More data raises success, far from saturation. Fine-tuning π0.5 jointly on 16 Level 2 rigid tasks with 20, 50, 100 and 200 demonstrations per task gives mean success of 21.4%, 27.8%, 29.6% and 31.8%. The single-arm dexterous suite rises from 31.0% to 53.0% and the dual-arm dexterous suite from 12.5% to 29.0%, while dual-arm gripper tasks fall from 20.0% to 12.0%.
The real-robot part uses 8 tasks on an X-Arm, with Meta Quest 3 teleoperation and two RealSense D435i cameras. A flow-matching policy is trained on 20 demonstrations per task and evaluated over 50 trials (Table IX of the paper):
| Task | Real world | Simulation |
|---|---|---|
| PickPlacePen | 100% | 80% |
| HangMug | 40% | 44% |
| Stack6Blocks | 10% | 10% |
| PingPongTransport | 0% | 0% |
| UnfoldShirt | 80% | 70% |
| FoldShirt | 40% | 44% |
| BagHanging | 10% | 6% |
| BuildTent | 0% | 0% |
The authors conclude that the real-world results largely preserve the difficulty ordering calibrated in simulation. Mapping the simulation column onto the level ranges above, the first four and the last four tasks each run exactly from Level 1 to Level 4 (an inference by this site; Figure 7 of the paper says only that the 8 tasks come from four difficulty levels).
How this connects to this site’s evaluation lessons
Physical AI Lab 2.8 shows how to put a Wilson interval on a success rate. By that method, 30 successes in 50 episodes (60%, the lower edge of Level 1) has a 95% Wilson interval of about 46.2%–72.4% (calculated by this site), which straddles the Level 1/Level 2 boundary. A single 50-episode evaluation cannot by itself settle which level a task near a boundary belongs to; the evidence that the grading is stable is the authors’ seed check, in which 96.4% of tasks keep their level across 3 seeds. Lesson 2.8 also warns that reporting only the best of several runs inflates the number, and ManiLadder’s calibration score is exactly the maximum over several evaluations during training (40k steps evaluated every 5k, about 8 evaluations, counted by this site from the step numbers). This is part of the grading rule and applies to every task alike, but s(T) should not be read as the success rate of an ordinary single evaluation. Paired comparison, failure labels and random seeds are covered in Physical AI Lab 1.8; the season plan is in the course overview.
Limitations
- This is an arXiv preprint; all numbers are reported by the authors [R] and this site did not reproduce them. The paper says the task definitions, demonstrations and evaluation protocol are frozen into a versioned release; the text read gives no download address for code or data.
- The difficulty levels are anchored to one 50M-parameter reference policy. With π0.5 or GPT6-Astra doing the calibration, about 26.7% and 39.1% of tasks change level (calculated by this site from Table III).
- Only the seed check reports a standard deviation. The per-suite tables, the AL results and the real-robot table give no intervals and do not say how many times training was repeated, so gaps of a few percentage points should not be read as a firm ordering.
- GPT6-Astra and the imitation policies have different inputs and budgets (20 extra exploration episodes and proprioception), so the comparison is between learning settings.
- The real-robot part is 8 tasks on one platform. It checks the difficulty ordering and is not a hardware safety validation.
Links
- ManiLadder: Benchmarking Robot Manipulation Through a Categorized and Multi-Difficulty Level Task Ladder (arXiv 2611.16374)
- Full paper in HTML
- Physical AI Lab 2.8: Reproducible Evaluation — Working Out Wald and Wilson Intervals by Hand, Sizing a Run from 1/√n, Then Bounding the Failure Rate after Zero Failures
- Physical AI Lab 1.8: Evaluation — Splitting a “Net Gain of 2” into a Paired Table, Then Checking the Failure Labels and Random Seeds
- Physical AI Lab: a physical AI course where every number can be checked