
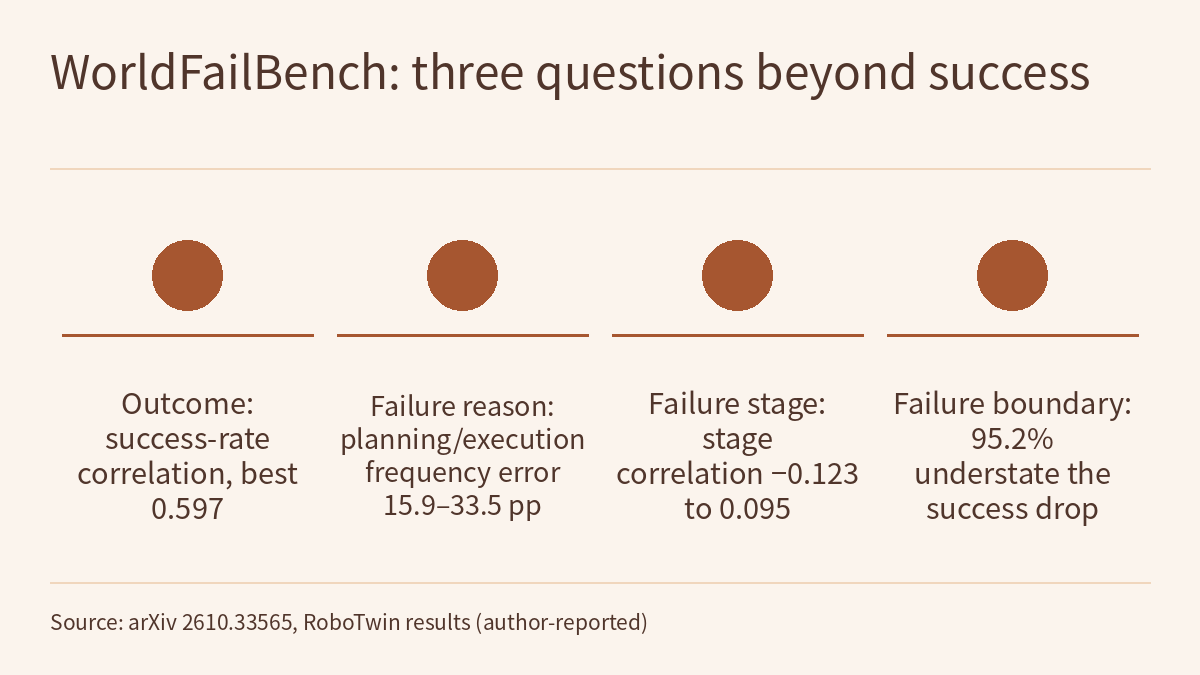
When a world model stands in for a real robot or a simulator to evaluate robot policies, the usual check is whether policy success rates inside the world model correlate with those in a reference environment. The preprint WorldFailBench (arXiv 2610.33565, 2026-10-24) asks three things that success rate leaves out: can a world model reproduce why a policy fails, at which stage the failure happens, and where success starts to collapse when the scene changes slightly? The authors evaluate seven world models on the LIBERO and RoboTwin simulation environments and on real-world tasks with the G1 humanoid robot. The main results come from RoboTwin: the average error in failure-type frequencies is 15.9–33.5 percentage points, the best stage correlation is only 0.095, and on 60 scene-change pairs 95.2% of predictions understate the size of the reference success-rate change. All numbers below are author-reported [R]; this site has not reproduced them.
Why comparing success rates is not enough
The common approach is outcome-based evaluation: run the same set of policies in the world model and in a reference environment (a conventional simulator or a real robot), then compare success rates through a cross-policy correlation. Token-World and PhysCanvas, both covered on this site, use this kind of correlation to judge whether a world model can serve as an evaluator. WorldFailBench argues that such agreement does not show that a world model faithfully simulates how a policy fails. Figure 1 of the paper illustrates three discrepancies with a cloth-collection task:
- Failure reason: in reference execution the policy grasps the cloth and drops it, an action execution failure; in the generated rollout it reaches for the basket, the wrong target, which is a task planning failure. Both count as failures, but the diagnosis steers improvement toward the wrong component.
- Failure stage: reference execution fails during placement, while the model predicts failure during transport; the final outcome agrees, the location of the failure does not.
- Failure boundary: after the basket is moved, reference success collapses while the model keeps predicting high success, overestimating the conditions under which the policy works reliably.
Physical AI Lab 1.8: Evaluation showed how a single “failure” label can hide how a policy failed. This paper turns the same question on the world-model evaluator itself: does the evaluator get the failure type and location right?
Three tasks and six metrics
Evaluation is closed-loop: at each step the policy chooses an action from its observation history, robot state and task instruction, and the world model predicts the next observation and returns it to the policy. Reference execution runs the same way in a simulator or on a real robot. Both sides fix the task instruction, the policy and the corresponding initial conditions.
| Task | Question asked | Metrics |
|---|---|---|
| Failure reason | How often task planning failures and action execution failures occur, and whether they vary across policies the same way | TFE: mean absolute difference in the two failure-type frequencies (lower is better); TPC: cross-policy Pearson correlation of each type’s frequencies (higher is better) |
| Failure stage | In which subgoal stage the earliest decisive failure falls | SFE: sum of absolute differences in stage-failure frequencies, range 0–2 (lower is better); SPC: cross-policy Pearson correlation of stage frequencies |
| Failure boundary | Direction and size of the success-rate drop between nearby scene conditions | OA: share of pairs with the same direction of change, ties scoring zero (higher is better); GE: mean absolute difference between the success-rate changes (lower is better) |
All frequencies use every evaluation episode as the denominator, successes included. Failures that cannot be classified are labeled Indeterminate, and failures with an unknown stage stay only in the denominator. As a reference point, the authors rerun the same policies from the same initial scenes in the reference environment on RoboTwin and LIBERO and compare the two reference executions with the same metrics. This Ref–Ref baseline indicates whether a model’s discrepancies exceed the random variation of reference execution itself.
Where the data comes from
Reference data for failure reason and failure stage: 50 reference executions from randomized scenes per task–policy setting, each with a corresponding world-model execution.
- LIBERO (simulation, single arm): 10 tasks × 3 policies (π0.5, plus π0.5-data-50 and π0.5-data-20, fine-tuned on 50% and 20% of the data), 1,500 rollouts.
- RoboTwin (simulation, bimanual): 20 tasks × 5 policies (adding LingBot-VLA-v2 and FastWAM), 5,000 rollouts.
- G1 (real robot, humanoid): 2 tasks, sweeping trash and collecting clothes, × 4 task-specific policy versions (V1–V4), 400 rollouts.
Failure boundaries are constructed only in simulation. One scene factor, object position, orientation or size, is scanned while everything else stays fixed; ten reference executions per condition identify adjacent condition pairs whose success rates differ by at least 30 percentage points. Each platform freezes 60 pairs and their endpoint order, then re-estimates reference success independently with fresh random seeds; pairs are not reselected or reordered afterwards. Each world model runs the same policy ten times at every endpoint. The paper’s example of “2 cm increments, success falling from 90% to 40%” is, as the authors state, a hypothetical illustration of the selection criterion, not a measured pair.
Annotation has two stages. For outcomes, two models, Doubao-Seed-2-1-Pro and ChatGPT 6, judge the videos with 90.1% agreement, and one expert adjudicates every disagreement; a random audit of agreed samples totaling 10% of the full dataset gives 97% agreement with human judgments. Final outcomes of simulated reference executions follow the simulator’s native checks. Failure type and stage are labeled by two experts for every failure, with 92% agreement before adjudication; a third annotator resolves disagreements.
The seven world models are Ctrl-World, Cosmos-Predict-2.5, BWM, DreamDojo, GE-Sim 2.0, A2World and DW05. BWM is not evaluated on LIBERO or G1 because compatible checkpoints and adaptation code were unavailable.
The model with the best success-rate correlation is not the best at failure diagnosis
All results below are on RoboTwin, and each correlation is computed over five policies.
- Failure type: DW05 has the highest success-rate correlation (0.597), but its correlations for planning and execution failures are only 0.456 and 0.348. Types can even disagree in sign: A2World correlates positively with reference planning failures (0.353) and negatively with execution failures (−0.086), while BWM shows the opposite (−0.121 versus 0.143). The highest aggregate TPC is 0.402. Mean TFE across the seven models ranges from 0.159 (DW05) to 0.335 (Cosmos), that is, the two failure-type frequencies are off by 15.9–33.5 percentage points on average; Ref–Ref is 0.061.
- Failure stage: SPC for the seven models ranges from −0.123 to 0.095. DW05 falls from a success-rate correlation of 0.597 to an SPC of 0.052, and GE-Sim from 0.260 to −0.004; Ref–Ref scores 0.942 and 0.903. Mean SFE ranges from 0.633 to 0.817, against 0.094 for Ref–Ref.
Figure 5 of the paper gives a concrete case: for FastWAM on the blocks_ranking_size task, reference failures concentrate at the “Grasp small” stage (66%), with 16% at “Place”; in DreamDojo’s generated rollouts the two figures are 6% and 46%. The authors report that this shift from grasping to placement appears across all five policies. A diagnosis based on it would focus improvement on placement, while the main problem in the reference environment lies in grasping.
A side note: Ctrl-World also appeared as a baseline in the Token-World article. That figure was reported by another paper under its own evaluation setup and cannot be compared directly with the RoboTwin figures here.
Small scene changes: wrong direction, compressed size
On the 60 RoboTwin boundary pairs, the highest OA per factor is 0.685 for position (A2World and BWM tied), 0.590 for orientation (GE-Sim) and 0.758 for size (Ctrl-World). Ref–Ref achieves OA of 0.95–1.00 and GE of 0.005–0.020. By the definition of OA, a value below 0.5 means that, averaged across settings, the share of pairs with the direction of change right is below one half; six of the seven models fall below 0.5 on orientation, GE-Sim being the exception.
On magnitude, 400 of the 420 comparisons (seven models × 60 pairs), or 95.2%, underestimate the absolute reference success-rate difference, making policies look less sensitive to scene changes than they are. Figure 6 shows LingBot-VLA-v2 on adjust_bottle: as bottle yaw changes from −60° to −80°, reference success drops from 100% to 0%. Four models predict an increase and one predicts no change; only A2World and GE-Sim identify the decline, and both predict a drop of just 20 percentage points.
The weaknesses also depend on the factor. Five models have their lowest OA on orientation, while DW05 and GE-Sim have theirs on size. Ctrl-World’s OA falls from 0.758 for size to 0.359 for orientation, where its GE (0.719) is also the highest of the seven; GE-Sim reaches 0.590 on orientation but only 0.424 on size. Testing one perturbation alone would miss the other. The authors suggest using failure-boundary evaluation to identify the conditions under which a world model’s predictions must first be checked in the reference environment, before they guide further testing.
Limitations
- This is an arXiv preprint; all numbers are author-reported [R] and have not been reproduced by this site. The main results come only from RoboTwin; LIBERO and G1 results are in Appendices D.4–D.7. The text this site read ends at Appendix A.1.3, so the Ref–Ref baseline details (Appendix A.4), the re-estimation of boundary pairs (Appendix C), Table 15 and the full data of Figures 10 and 11 were not read.
- Each correlation is computed over only five policies and then averaged across tasks. In this site’s judgment, such correlations are sensitive to changes in individual policies; in the portion read, the paper gives no confidence intervals or significance tests.
- Limitations the authors state themselves: the set of policies, tasks and boundary conditions is finite, which limits generality; the results characterize complete world-model systems, including their adapters and rollout schedules, without isolating architectural components; failure labels describe observable behavior and do not establish internal policy causes.
- Outcome annotation relies partly on two vision-language models, followed by human adjudication and auditing; failure types are split into only two classes, planning and execution. The benchmark comparison in Table 1 is the authors’ own summary.
- The four G1 policy versions are cited from Kairos (arXiv 2606.16533), whose author list includes two of this paper’s authors. The paper’s front page lists a GitHub code repository and a Hugging Face dataset; this site has not opened them to check their contents.
- Neither world-model rollouts nor simulated boundary pairs are a hardware safety validation.
Links
- WorldFailBench: Do World Models Understand Policy Failures? (arXiv 2610.33565)
- Full paper in HTML
- Frontier Radar | Token-World: rolling out a world model in VLM token space to simulate VLA policies without RGB reconstruction
- Frontier Radar | PhysCanvas: drawing vision, touch and task state on one canvas, then using three frozen reward models to bring world-model outcomes closer to the real robot
- Frontier Radar deep dive | Simulation and evaluation: what VLA evaluation is missing beyond initial-state success rate
- Physical AI Lab 1.8: Evaluation — Splitting a “Net Gain of 2” into a Paired Table, Then Checking the Failure Labels and Random Seeds
- Physical AI Lab: a physical AI course where every number can be checked (course outline)