Using an action-conditioned video world model in place of a real robot to evaluate and post-train policies only works if the consequences it predicts can be trusted. In the preprint PhysCanvas (arXiv 2610.28613, 2026-10-20), authors from the Institute of Automation of the Chinese Academy of Sciences, Anyverse Robotics, the Open-Phoenix Team, the National University of Singapore, Xi’an Jiaotong University and the Beijing Institute of Technology point out that a plausible-looking frame does not mean the contact is right: if an object has already slipped but the model still predicts stable tactile contact or eventual success, the rollout misleads both policy evaluation and policy optimization. PhysCanvas lays out multi-view RGB, tactile images, tactile marker displacement and task state on a single image “canvas”, predicts it with one shared video VAE and pretrained generative backbone, and then uses three frozen reward models to constrain scene preservation, visual–tactile consistency and task outcome. The authors report that on four real-world bimanual tasks, adding task-state supervision raises the mean task-wise Pearson correlation between a policy’s success rate in the world model and its real-world success rate from 0.602 to 0.885, and that GRPO post-training inside the reward-guided world model raises π0.5’s mean real-world success rate from 59.1% (SFT) to 70.8%. All numbers below are author-reported [R]; this site has not reproduced them.
The problem: visually plausible, yet wrong about contact and outcome
The paper sees two gaps in existing approaches. First, current visuo-tactile world models usually need a dedicated tactile encoder plus a custom interface for injecting tactile features into a general backbone, so a new kind of tactile data or sensor configuration may require retraining. Second, token-wise reconstruction supervision emphasizes local fidelity and can miss high-level semantics such as whether the task succeeded. The authors therefore ask two questions: can a simple, general mechanism encode heterogeneous modalities in one shared space, and can high-level semantics be injected into the world model without additional networks?
Why touch needs modeling of its own was covered in Physical AI Lab 1.3: Sensors: an optical tactile sensor, with a small camera behind a soft gel pad, can tell whether an object is slipping and how coarse its texture is. Physical AI Lab 1.4: A Map of Simulators explained that the hardest thing for a physics simulator to compute is the moment of contact. PhysCanvas takes a different route: instead of writing a contact model, it lets a video generation model predict the tactile images directly, then checks whether they agree with the RGB and with the task outcome.
One canvas: four observations share one video VAE, and actions are drawn as images too
The authors first test a premise: can a visual VAE pretrained on large-scale image and video data encode optical tactile images directly? On the USB 3D-pose tactile dataset released with UniT, the Wan VAE without tactile fine-tuning reaches a PSNR of 35.51 and an LPIPS of 0.0139, against 31.72 and 0.0210 for the tactile-specific UniT VAE; on SSIM, UniT is higher (0.9613 vs. 0.9539). The authors take this as evidence that the visual representation transfers to optical touch, and adopt Wan’s image-to-video model.
The appendix specifies how the canvas is laid out:
- RGB: one fixed base view and two wrist views, each cropped and resized to 224 × 224 and concatenated horizontally into a 224 × 672 strip, recorded at 10 Hz.
- Tactile image: the Xense internal camera’s difference image relative to a sensor reference (400 × 700 × 3), inserted into the canvas directly.
- Marker displacement: 35 × 20 = 700 markers per tactile pad; the three-dimensional offset is taken relative to the episode’s first frame, each component is clipped to [−s, s] (s = 0.06 in cache-native units, an encoding scale rather than a physical bound) and normalized, and x, y and z are mapped to R, G and B. Quantitative statistics are still computed from the unencoded displacement.
- Task state: color identifies the task and texture (vertical or horizontal low-frequency bands) distinguishes “success condition not satisfied / satisfied”. It is only an auxiliary objective that teaches the world model task semantics; downstream policies do not use the predicted state.
Camera views run horizontally and modalities are stacked vertically; the whole canvas goes through one VAE and the Wan 2.2 diffusion transformer, so all modalities share spatiotemporal self-attention. The action condition is the target dual-arm joint configuration (including gripper state). Following iMaC, the authors apply the configuration to the robot URDF, run forward kinematics and project the result into each view with the camera intrinsics and extrinsics, producing “action images” spatially aligned with the observations. These are encoded by the same VAE and added position-wise to the noisy canvas tokens, except in the task-state region, which forces state prediction to draw on the other modalities through self-attention. During generation, the episode’s initial RGB frame enters through cross-attention as a fixed anchor, while the current reference tokens are updated from the last frame of the preceding chunk.
Training details: the model is initialized from Wan2.2-TI2V-5B (5 billion parameters); the VAE is frozen and the transformer fine-tuned with a flow-matching objective. Each training example is generated recursively in four chunks of eight frames, with the loss averaged over the four chunks, so the model is trained on its own generated context. Training runs for 300 epochs on 64 PPU-ZW810E accelerators and takes about three days. At inference, each chunk starts from noise and is denoised in 5 steps to produce eight frames, and generation can continue until the end of the episode.
Three frozen reward models, one for each kind of consistency
All three reward models are a ResNet-18 encoder with an MLP or Transformer decoder, trained in advance and kept frozen while they post-train the world model:
- Scene Reward Model: takes the episode-initial RGB and one future RGB frame and judges whether scene identity and objects are preserved. Positives are real observations and scene-consistent generations, negatives are scene-inconsistent generations, with balanced classes.
- State Reward Model: takes one future RGB frame and judges whether the task’s success condition holds. It is trained only on real trajectories: frames before completion are labeled 0, frames from completion onward 1.
- Modality Reward Model: takes paired RGB, tactile-image and marker-displacement regions and judges whether their contact evidence is compatible. Negatives keep the RGB fixed and swap in a different tactile state, so it supervises cross-modal agreement rather than the presence of contact.
State supervision does not push every prediction toward success: the target label is the same State RM’s thresholded score on the corresponding real frame, and the generated frame’s success logit is trained against it with binary cross-entropy, so when the real trajectory fails, the generation should fail too. For scene and modality, the world model directly maximizes the scores the reward models assign. Gradients flow through the frozen reward models and the VAE decoder back into the world model, and the first-stage flow-matching loss is retained.
The ablations do not all move in the same direction. Adding scene consistency lowers RGB LPIPS by 14.2% and FVD by 10.4%. Adding state supervision then lowers FID by 26.4% and FVD by 12.5%, but PSNR drops from 20.975 to 20.699 and LPIPS rises from 0.097 to 0.132. Adding modality consistency lowers contact MAE from 0.02491 to 0.02278 and all three marker-displacement errors, while tactile event F1 dips slightly from 0.4550 to 0.4455. For the examples in Figures 6 and 7, such as “after the gripper is forced open, the block falls and the tactile response disappears”, the authors state that they are qualitative illustrations, not measurements of contact accuracy.
In the RGB comparison with EVAC, Open-Sora and WoVR, PhysCanvas is best on PSNR, SSIM, LPIPS, FID and FVD, and its end-effector tracking error is 0.685 pixels, 51.9% lower than the next-best baseline. Its lead on the VBench Subject and Smooth scores is small, and on background consistency WoVR is higher (91.082 vs. 90.565).
As an evaluator: correlating world-model and real-world success rates
The platform is an ARX AC One dual-arm robot, each arm with six joints and a gripper, three cameras and four Xense optical fingertip tactile sensors. All four tasks require both arms: handing over a test tube and using contact with the table to reorient it in-hand before inserting it into a rack; separating two connected blocks and placing each into the bag of the matching color; stabilizing a bottle with one gripper while the other unscrews the cap; and restoring a Rubik’s Cube scrambled by a single face turn. The world model is trained on 3,805 real-robot policy rollouts (1,000, 1,000, 926 and 879 for the four tasks), collected by executing task policies stochastically, so they include naturally occurring failures such as missed grasps, premature release, inaccurate handover, misalignment and incomplete insertion or placement; another 80 test rollouts per task are held out.
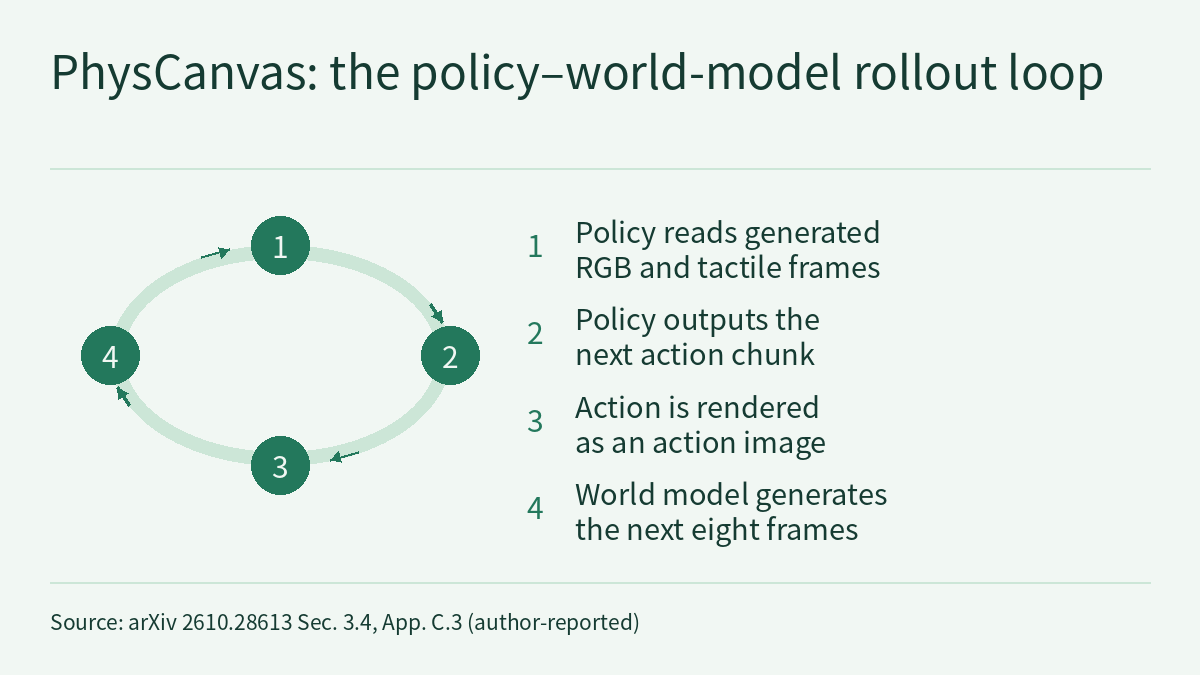
For evaluation, a rollout starts from a real initial observation: the policy reads the observation generated by the world model and issues the next action chunk, and the world model returns the predicted visual, tactile and task-state consequences, in a closed loop. The policies evaluated are ACT, a flow-matching policy (FM) and π0.5, all taking RGB, robot state and tactile marker displacement as input. Each task–policy pair has three batches of 20 scenes, collected at different times; whether each real-world scene succeeds is judged jointly by multiple human experts. Each task therefore has nine batch points (three policies × three batches); each point compares the success rate in the world model with the real-world success rate, the Pearson correlation is computed within each task, and the four task correlations are averaged with equal weight.
Going from ℳ2, which has only scene consistency, to ℳ3, which adds state supervision, raises the mean correlation from 0.602 to 0.885 and the mean R² from 0.413 to 0.791. The gains are largest on the test tube and blocks, moderate on the bottle and minimal on the Rubik’s Cube, where the authors say ℳ2 is already near the ceiling. Because the same change moved low-level reconstruction metrics in both directions, the authors suggest the gain reflects better task-semantic modeling rather than better pixel reconstruction.
Token-World, covered earlier on this site, also uses the correlation between simulated and reference success rates to judge whether a world model can serve as an evaluator. The two papers differ in tasks, policies, batch design and how the correlation is computed, so 0.885 cannot be compared directly with that paper’s numbers. Frontier Radar deep dive | Simulation and evaluation surveyed questions such as policy-oriented simulation fidelity; PhysCanvas offers one approach that can be checked against real robots. Note also that each task’s correlation rests on only nine points (the paper states that each task has nine evaluation batches).
As a training ground: real-world success after GRPO
For post-training, the policy starts from real initial observations and interacts in imagined closed loops inside the world model; the frozen State RM scores the task outcomes, and GRPO (group-relative policy optimization) turns the differences among these outcomes into learning signals. Neither the world model nor the reward model is updated, only the policy, and no new robot trajectories are collected. FM and π0.5 are post-trained; ACT is omitted because it does not use the diffusion or flow-matching formulation assumed by the authors’ GRPO implementation.
Note that the comparison here differs from the previous section: “RL in WM” uses ℳ1, which has only spatially aligned action injection and no consistency supervision, as the simulator, while “RL in WM+RM” uses ℳ4, with all three consistency objectives; both use the frozen State RM for scoring. Real-world success rates are means ± population standard deviation over three runs:
| π0.5 | Test Tube | Bottle | Blocks | Rubik’s Cube | Four-task mean |
|---|---|---|---|---|---|
| SFT | 50.0 ± 7.0 | 88.3 ± 4.7 | 46.6 ± 2.3 | 51.6 ± 6.2 | 59.1 |
| RL in WM (ℳ1) | 60.0 ± 4.0 | 90.0 ± 0.0 | 56.6 ± 4.7 | 63.3 ± 4.7 | 67.5 |
| RL in WM+RM (ℳ4) | 60.0 ± 8.1 | 86.6 ± 2.3 | 63.3 ± 4.7 | 73.3 ± 4.7 | 70.8 |
FM’s four-task mean rises from 11.2% to 16.6% (ℳ1) and 19.1% (ℳ4); the gains occur only on the bottle and blocks, while the test tube and Rubik’s Cube stay at 0. For π0.5, ℳ4’s additional gains over ℳ1 are mainly on blocks and the Rubik’s Cube (6.6 and 10.0 percentage points; 6.6 for blocks is the authors’ figure, and the table difference is 6.7), while the bottle drops from 90.0% to 86.6%, which by the table is also below SFT’s 88.3% (this site’s comparison). The authors conclude that average real-world success improves, but the benefit varies by task.
When a policy is optimized against a learned reward in a generated environment, the reward gaming discussed in Physical AI Lab 1.7: Reinforcement Learning is the risk to watch; this paper’s check is to evaluate on the real robot at the end. Physical AI Lab 1.8: Evaluation practiced judging whether a difference of a few percentage points holds up: several differences in the table are of the same order as the standard deviations (for example, test tube 50.0 ± 7.0 vs. 60.0 ± 8.1), and the text read reports no significance test.
Limitations
- This is an arXiv preprint; all numbers are author-reported [R] and this site has not reproduced them. The text this site read ends at Appendix D.3 (policy architectures), and the later appendices were not read. The text gives a project page address but does not say whether code, data or weights are released, and this site did not open the project page.
- The evaluator result (0.602→0.885) compares ℳ2 with ℳ3; the post-training result (59.1%→67.5%→70.8%) compares ℳ1 with ℳ4. The two sets of numbers come from different model variants and cannot be merged into a single conclusion about “how much consistency supervision adds”.
- There is one dual-arm platform, four tasks and three policies; each task’s correlation rests on nine batch points. π0.5’s post-trained result on the bottle task is below SFT, and FM stays at 0 on two tasks.
- The State RM both supplies state supervision for the world model and scores the policy during GRPO; it is a binary classifier trained only on RGB from real trajectories, and the text read does not report its classification accuracy separately.
- The tactile reconstruction comparison between the Wan VAE and the UniT VAE uses a single public tactile dataset, and UniT is higher on SSIM. The examples in Figures 6 and 7 are, by the authors’ own description, qualitative illustrations, not contact-accuracy measurements.
- Neither world-model predictions nor real-world success rates are a hardware safety validation; the paper does not present this method as a safety assessment.
Links
- Physical Canvas: A Vision Tactile World Model for Robot Policy Evaluation and Learning (arXiv 2610.28613)
- Full paper in HTML
- Frontier Radar | Token-World: rolling out a world model in VLM token space to simulate VLA policies without RGB reconstruction
- Frontier Radar deep dive | Simulation and evaluation: what VLA evaluation is missing beyond initial-state success rate
- Physical AI Lab 1.3: Sensors — Working Out Pixels, Depth Range and Grip Force for One Cup
- Physical AI Lab 1.4: A Map of Simulators — Counting the Cost of the Timestep, Finding Where Contact Splits Two Runs, and Pinning Three Speed-ups to Their Baselines
- Physical AI Lab 1.7: Reinforcement Learning — Working Out One Episode’s Return to See How a Reward Gets Gamed, Then Reading the Paper’s Terrain Curriculum and Time-out Resets
- Physical AI Lab 1.8: Evaluation — Splitting a “Net Gain of 2” into a Paired Table, Then Checking the Failure Labels and Random Seeds
- Physical AI Lab: a physical AI course where every number can be checked (course outline)